The U.S. Census Bureau has released its latest report on poverty and the news isn’t good—with one exception.
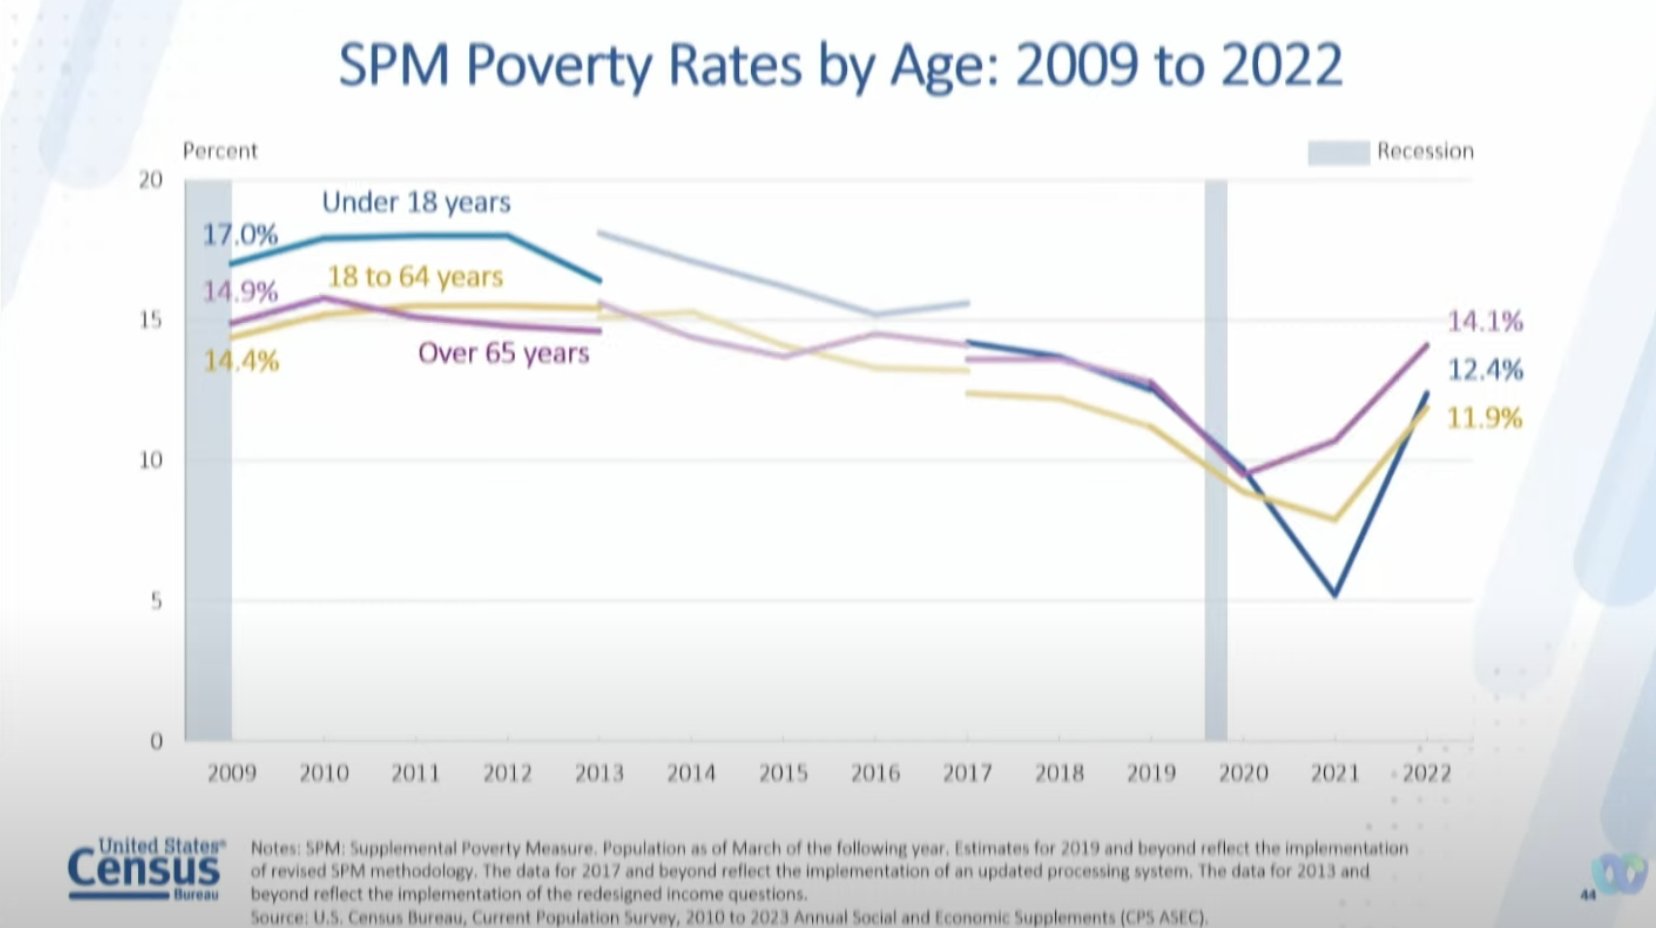
Most dramatically, the child poverty rate leapt to 12.4% in 2022, after falling to 5.2% in 2021. (In 2020 the rate was at 9.0%.) This significant shift is mostly due to Congress failing to renew the Child Tax Credit that was put in place during the pandemic. This was the first time the poverty rate increased since 2010.
A 7.8% increase in consumer prices—the highest jump since 1981—left families struggling to keep up, as real median household income fell by 2.3% to $76,330, which is about 4.7% below the 2019 median.
Overall, the official poverty measure was 11.5%, or 37.9 million people living in poverty. This number was unchanged from 2021 to 2022. However, there was one positive shift in the numbers: 2022 marked the lowest official poverty measure rate on record for Black Individuals.
That said, it important to note that the U.S. Census reports on two measures of poverty, the “official poverty measure” and the “Supplemental Poverty Measure” or SPM. Per the U.S. Census Bureau, these terms are defined as: The official poverty measure, in use since the 1960s, defines poverty by comparing pretax money income to a poverty threshold that is adjusted by family composition. The SPM, first released in 2011 and produced with support from the U.S. Bureau of Labor Statistics (BLS), extends the official poverty measure by accounting for many government programs that are designed to assist low-income families but are not included in the official poverty measure. The SPM also includes federal and state taxes and work and medical expenses. In addition, the SPM accounts for geographic variation in poverty thresholds, while the official poverty measure does not.
The SPM rate in 2022 was 12.4%, an increase of 4.6% over 2021.
SPM poverty rates by demographics:
Under age 18
2020: 9.7%
2021: 5.2%
2022: 12.4%
18-64
2020: 8.9%
2021: 7.9%
2022: 11.9%
65 and over
2020: 9.5%
2021: 10.7%
2022: 14.1%
(Source: U.S. Census Bureau)

